Motivating biology and datasets
Thus, from the war of nature, from famine and death, the most exalted object which we are capable of conceiving, namely, the production of the higher animals Clarkia flower, directly follows. There is grandeur in this view of life, with its several powers, having been originally breathed by the Creator into a few forms or into one; and that, whilst this planet has gone circling on according to the fixed law of gravity, from so simple a beginning endless forms most beautiful and most wonderful have been, and are being evolved.
— Charles Darwin,
On the Origin of Species (1859)
Wouldn’t it be cool if, at this stage, the populations could evolve a mechanism to preferentially mate with their own kind? The adaptive evolution of avoiding mating with a closely related species—a process known as reinforcement—does just that. However, the evolution of reinforcement is complex and has only been conclusively documented in a handful of cases.
Dave Moeller and colleagues (including me) have been investigating one potential case of reinforcement. Clarkia xantiana subspecies parviflora (hereafter parviflora) is an annual flowering plant native to California. Unlike its outcrossing sister subspecies, Clarkia xantiana subspecies xantiana (hereafter xantiana), parviflora predominantly reproduces through self-pollination.
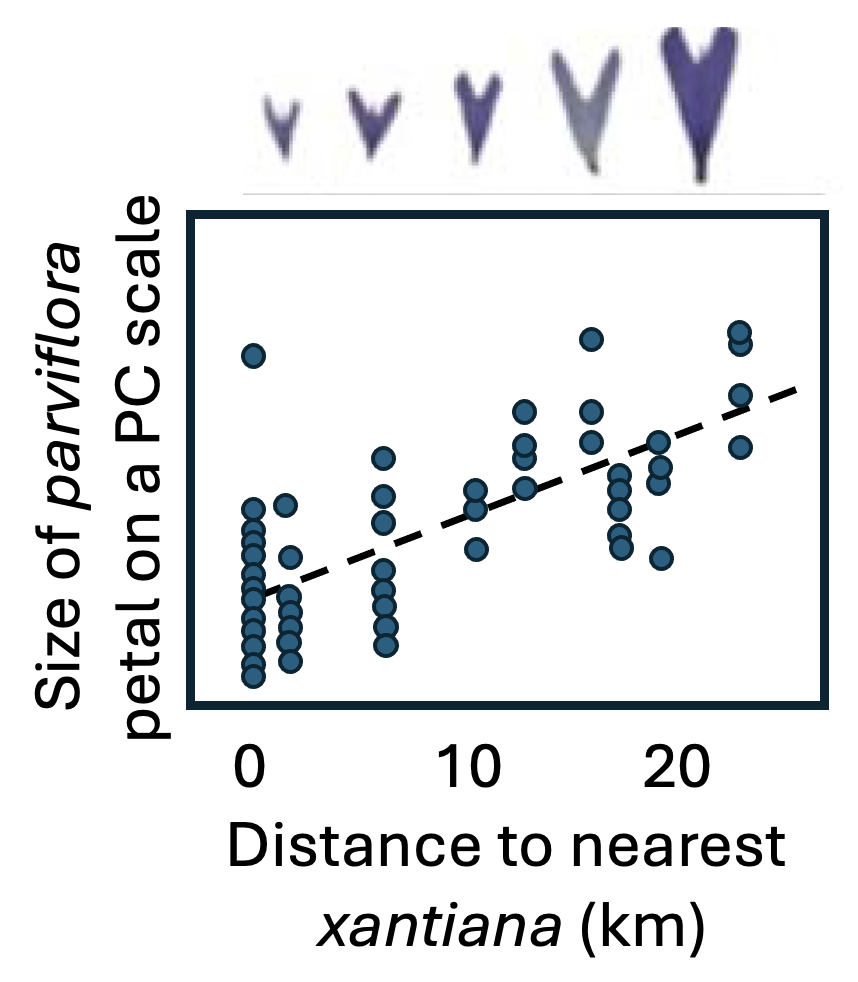
Not all populations of parviflora self-fertilize at the same frequency. Dave has observed that populations sympatric with (i.e., occurring in the same area as) xantiana appear more likely to self-fertilize than allopatric populations (Figure 1). Over the past few years, we have conducted numerous studies to evaluate the hypothesis that this increased rate of self-fertilization has evolved via reinforcement as a mechanism to avoid hybridizing with xantiana.
Throughout this book, I will use data related to the topic of divergence, speciation, and reinforcement between Clarkia subspecies as a path through biostatistics. I hope that this approach allows you to engage with the statistics while not having to keep pace with a bunch of different biological examples. Below, I introduce the major datasets that we will explore.
RILs between sympatric and allopatric parviflora
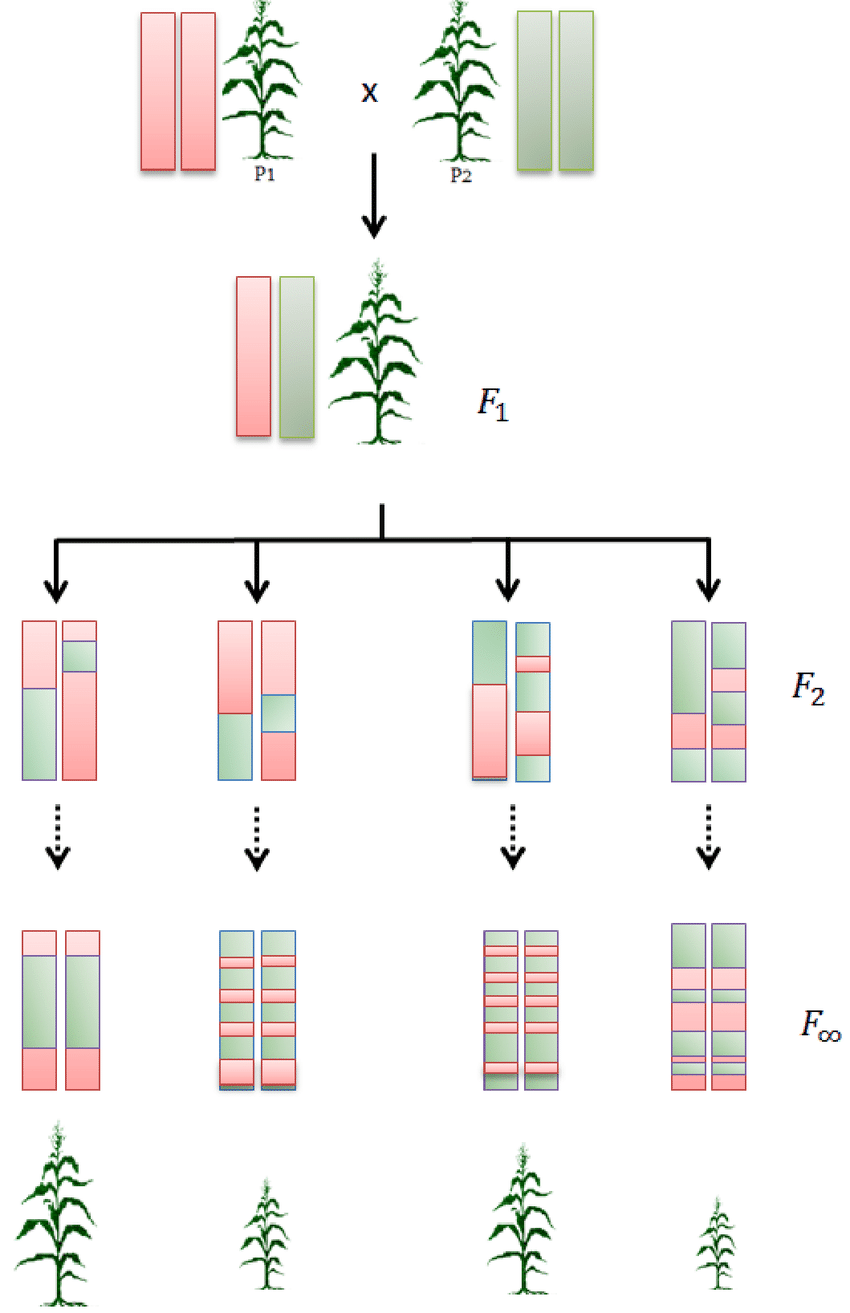
To investigate which traits, if any, help parviflora populations sympatric with xantiana avoid hybridization, Dave generated Recombinant Inbred Lines (RILs). To do so, he crossed a parviflora plant from “Sawmill Road”—a population sympatric with xantiana—with a parviflora plant from “Long Valley,” far from any xantiana populations. After this initial cross, lines were self-fertilized for eight generations. This process breaks up and shuffles genetic variation from the two parental populations while ensuring each line is genetically stable.
By setting these RILs out in the field and observing how many pollinators visited each line, we hope to identify which traits influence pollinator visitation and ultimately hybridization. Because parviflora plants often self-pollinate and because pollinators effectively transfer pollen from the plentiful xantiana plants to parviflora, we assume that greater pollinator visitation corresponds to higher hybrid seed set. However, we will test this assumption!!!
RIL Data
Below is the RIL dataset. You can learn about the columns (in the Data dictionary tab) and browse the data (in the Data set tab). The full data are available at
this link. Aside from pollinator visitation and hybrid seed set, all phenotypes measured come not from the plants in the field, but means from replicates of the genotype grown in the greenhouse.
| Variable_Name | Data_Type | Description |
|---|---|---|
| ril | Categorical (Factor/String) | Identifier for Recombinant Inbred Line (RIL). This is the 'genotype'. |
| location | Categorical (Factor/String) | Field site where the plant was grown. |
| prop_hybrid | Numeric (discrete) | Proportion of genotyped seeds that were hybrids (see num_hybrid and offspring_genotyped for more information). |
| mean_visits | Numeric | Average number of pollinator visits per plant over a 15-minute observation. |
| growth_rate | Numeric | Growth rate of the plant. |
| petal_color | Categorical (Binary) | Petal color phenotype (in this case 'pink' or 'white'). |
| petal_area_mm | Numeric | Date when the first flower opened (in Julian days, i.e., days since New Year's). |
| date_first_flw | Date | Node position of the first flower on the stem. |
| node_first_flw | Numeric | Petal area measured in square millimeters (mm²). |
| petal_perim_mm | Numeric | Petal perimeter measured in millimeters (mm). |
| asd_mm | Numeric | The Anther-Stigma Distance (ASD) is the linear distance between the closest anther (the floral part that releases pollen) and the stigma (the floral part that accepts pollen) in a flower, measured in millimeters (mm). The smaller this distance, the more opportunity for self-fertilization. |
| protandry | Numeric | Degree of protandry (e.g., time difference between male and female phase) measured in days. More protandry means more outcrossing. |
| stem_dia_mm | Numeric | Stem diameter measured in millimeters (mm). |
| lwc | Numeric | Leaf water content (LWC). |
| crossDir | Categorical (Binary) | Cross direction |
| num_hybrid | Numeric (discrete) | The number ofseeds that where hybrid. |
| offspring_genotyped | Numeric (discrete) | The number of seeds genotyped. |
RIL Hybridization Data
Below is the hybridization dataset. For each plant in the field we genotyped eight seeds at species-specific markers to identify if they were the product of hybridization with xantiana. The phenotypes belong to the genotype of the maternal plant (i.e. they are the same as those in the pollinator visitation data set). I include data at both the level of the seed and a summary at the level of the maternal plant.