• 1. Orientation to RStudio
Motivating scenario: you have just downloaded R and RStudio, and want to understand all the stuff that you see when you open RStudio.
Learning goals: By the end of this sub-chapter you should be able to
- Identify the source pane and what to do there.
- Identify the terminal pane and what to see and do there.
- Identify the environment / history pane, what to see and do there, and how to navigate tabs in this pane.
- Identify the file / plot / help / viewer pane, what to see and do there, and how to navigate tabs in this pane.
Above, you ran R in this web browser, but more often you will work with R in RStudio. When you open RStudio for the first time, you will see three primary panes. The one on the left works identically to the basic R console. Navigating to ‘File > New File > R Script’ opens a new script and reveals a fourth pane.
R Scripts are ways to keep a record of your code so that you can pick up where you left off, build on previous work, and share your efforts. We will introduce R Scripts more formally soon!
Like the R console above (and all computer languages) RStudio does not “know” what you wrote until you enter it into memory. There are a few ways to do this, but our preferred way is to highlight the code you intend to run, and then click the Run button in the top right portion of the R script pane (Alternatively, press Ctrl+Return for Windows/Linux or ⌘+Return on OS X).
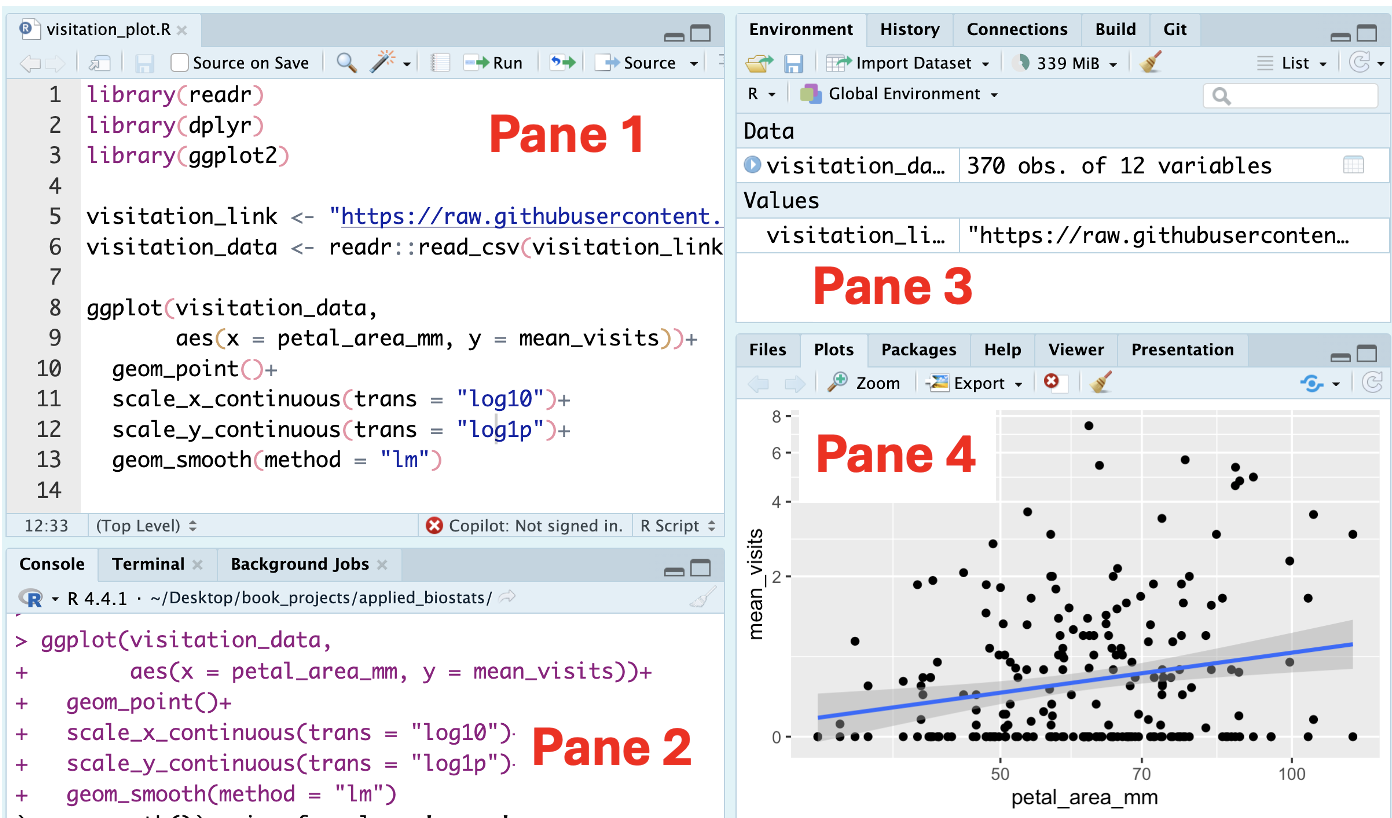
Figure 1 Shows what your RStudio session might look like after doing just a little bit of work:
The source pane Pane 1 is used for writing and editing scripts, R Markdown files etc… This is where you write reproducible code that can be saved and reused.
The console pane Pane 2 is basically the R command prompt from vanilla
R, it is where you directly interact withR. You can type commands here to execute them immediately. It will display output, messages, and error logs.The environment / history pane Pane 3 shows what
Rhas in working memory and what it has done.- The Environment Tab shows all objects (e.g., data frames, vectors) currently in memory.
- The History Tab shows all the commands you have run in your session. You can even search through your history, which makes this an easier place to look for some older code than the command prompt.
- The Environment Tab shows all objects (e.g., data frames, vectors) currently in memory.
The files / plots / help / viewer pane. Pane 4 is remarkably useful!
The Plots Tab shows the plots generated during your session. You can delete an individual plot by clicking the red X button, or delete all plots by clicking the broom button.
The Help Tab: allows you to access documentation and help files.