Intro to R
Get everyone up to speed on reading, writing, and debugging code in
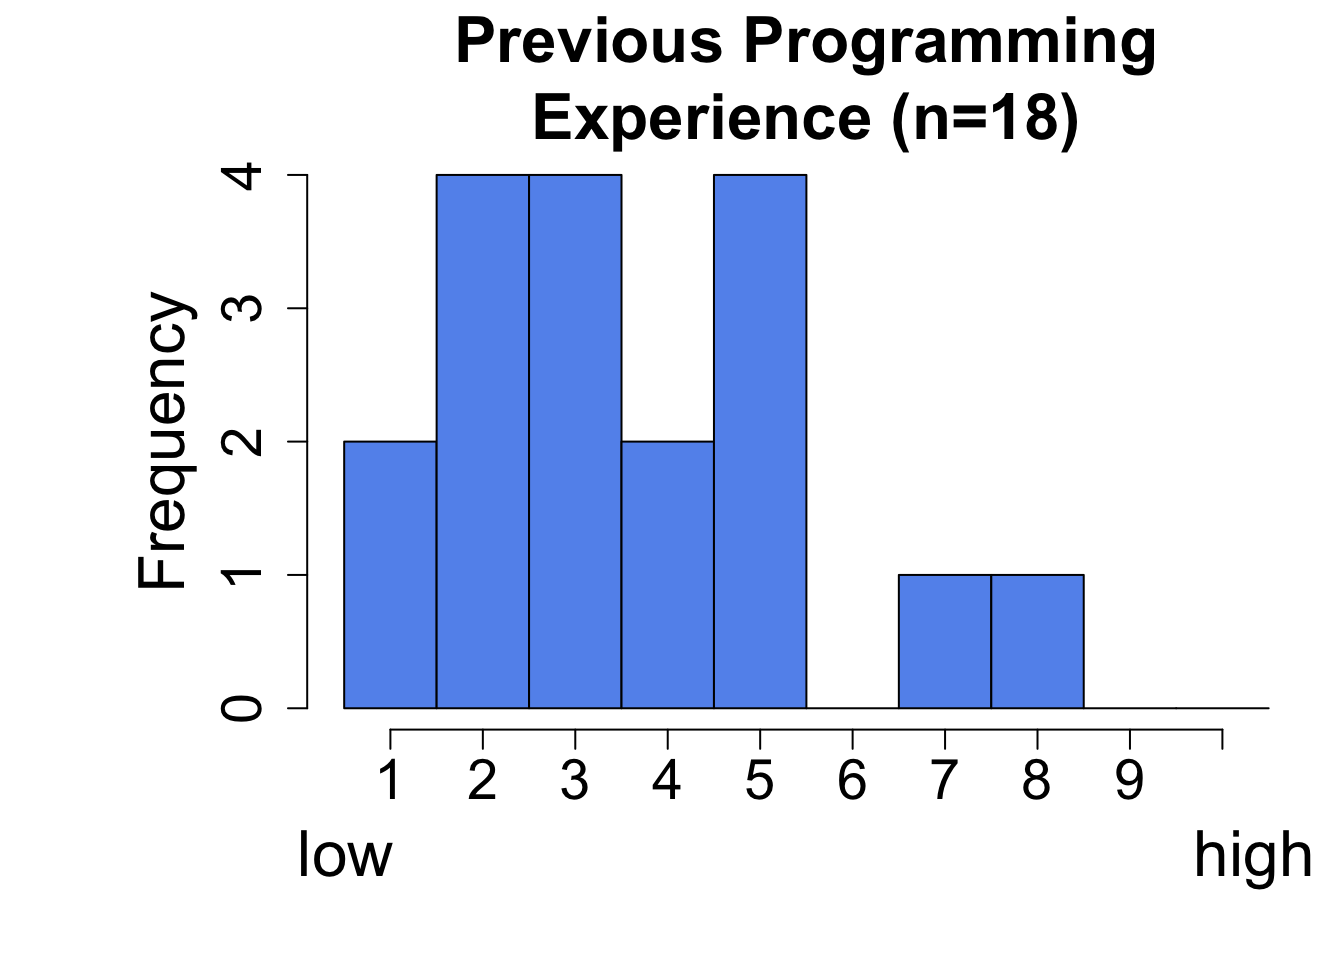
R: Students in this course typically have a wide range of prior programming experience (Figure 1). I aim to get beginners quickly get up to speed, and advanced users will discover new techniques and have opportunities to support their peers.Focus on understanding
R’s philosophy and solving programming problems: We are not here to write fancy code. We are here to do stats. Make sure your code works and is readable. Don not aim for perfection.Prepare for standard usage of R in statistics: Later the stats get tough. By that point R should be routine.
A “tidyverse” Approach
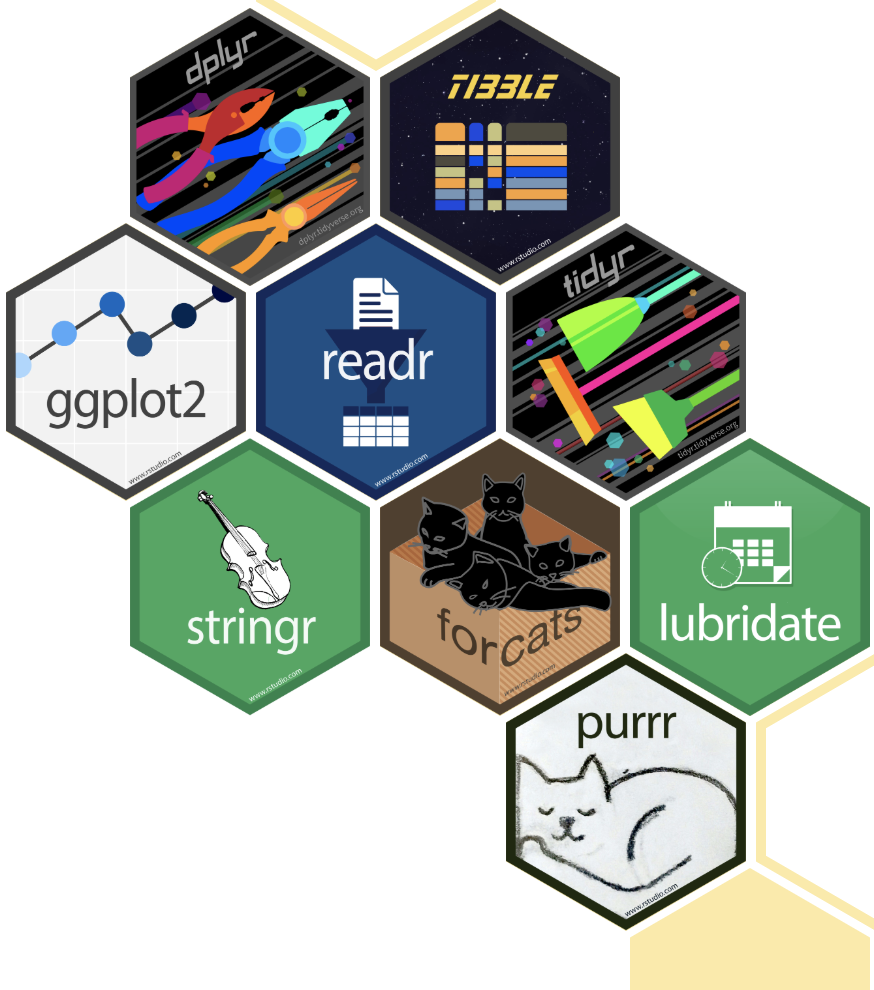
As R has evolved over time and its capabilities can be extended with packages (we will discuss this soon), different “dialects” of R have emerged. While many of you have likely seen Base R – built on the standard R program you download, here we will use Tidyverse – a specific and highly standardized set of packages designed for data science workflows (Figure 2). As a broad over generalization, Base R allows for much more control of what you are doing but requires more programming skill, while tidyverse allows you to do a lot with less programming skill.
I focus on tidyverse programming, not because it is better than base R, but because learning tidyverse is a powerful way to do a lot without learning a lot of formal programming. This means that you will be well prepared for a lot of complex data analysis. If you continue to pursue advanced programming in R (or other languages) you will have some programming concepts to catch up on.
If you already know how to accomplish certain tasks with base R tools, I encourage you to invest the time in learning the equivalent approaches in tidyverse. While it may feel redundant at first, this foundation knowledge will make you a more versatile and effective R programmer in the long term, and will allow you to make sense of what we do throughout the term.
Important hints for R coding
Years of learning and teaching have taught me the following key points about learning R. These amount to the simple observation that a students mindset and attitude towards leanring and using R is the most important key to their success. I summarize these tips in the video and bullet points, below.
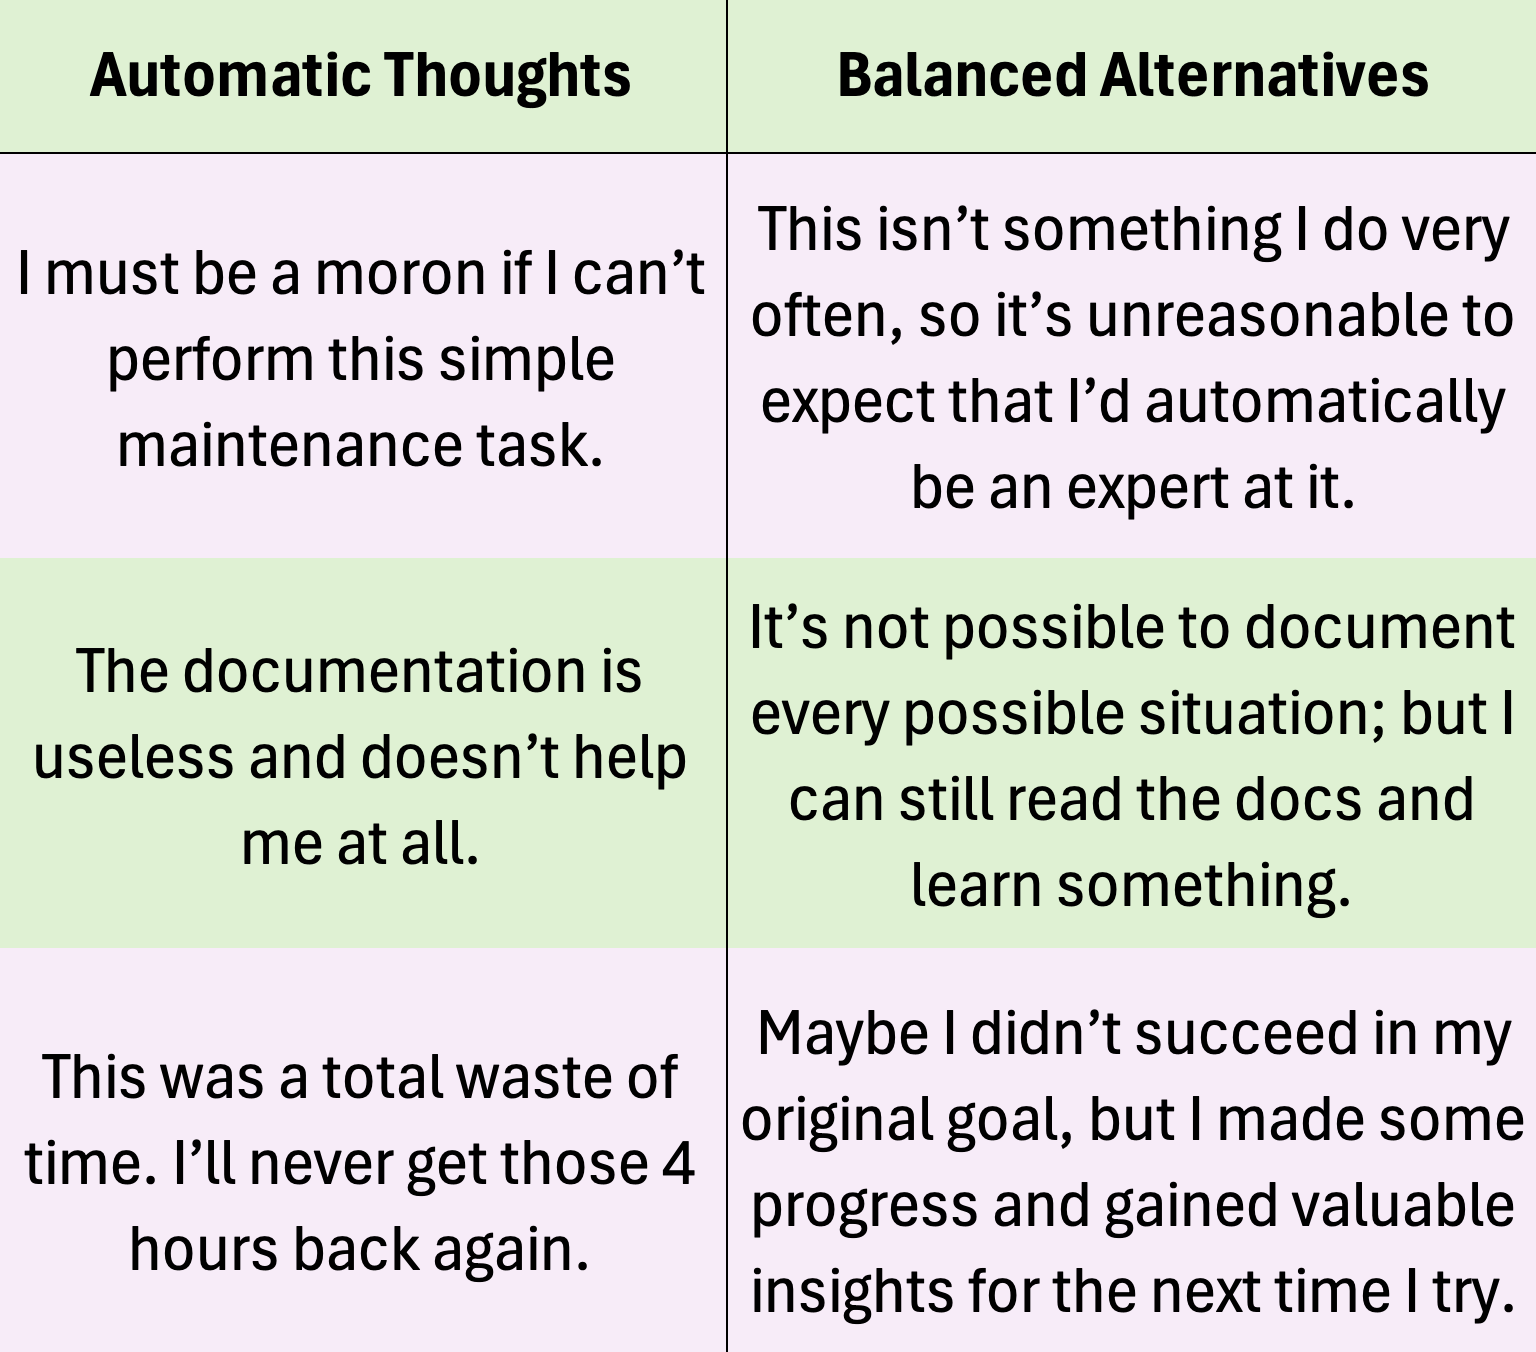
Be patient with yourself. Every expert R programmer started exactly where you are now. Your understanding will grow naturally as you tackle real problems and challenges. Do not beat yourself up, you are learning. Replace automatic negative thoughts with balanced thoughts (Figure 3).
Ris literally a language. Languages take a while to learn – at first, looking at an unfamiliar alphabet or hearing people speak a foreign language makes no sense. Aluksi vieraan aakkoston katsominen tai vieraan kielen puhumisen kuuleminen ei tunnu lainkaan järkevältä. With time and effort, you can make sense of a bunch of words and sentences but it takes time. You are not dumb for not understanding the sentence I pasted above (and if you do understand it it is because you know Finnish, not because you are smart).You don’t need to memorize anything. You have access to dictionaries, translators, LLMs etc etc. That said, these tools or more usefull the more you know.
Do not compare yourself to others. R will come fast to some, and slower to others. This has absolutely nothing to do with either you intelligence or your long-term potential as a competent R user.
Start small and don’t be afraid to experiment. There is nothing wrong about typing code that is imperfect and/or does not work out. Start with the simplest way of addressing your problem and see how far you get. Start small, maybe with some basic data analysis or creating a simple plot. Each little victory builds your confidence. You can always try new and more complex approaches as you go.
What’s ahead?

Now we begin our intro to R. While we will keep practicing what we have learned and learning new R stuff all term, the next four chapters, listed below. will get you started:
Getting up and Running This section introduces RStudio, math in R, vectors, variable assignment, using functions, r packages, loading data (from the internet), and data types. There is a lot here!
Data in R Here we continue on our introduction to R. We first introduce the concept of tidy data, and introduce the capabilities of the tidyverse package, dplyr.
Intro to ggplot The ggplot package allows us to make nice plots quickly. We will get started understanding how ggplot thinks, and introduce the wide variety of figures you can make. Later in this term we will make better figures in ggplot.
Reproducible science We consider how to collect data, and store it in a folder. We then introduce the concept of R projects and loading data from our computer. Finally, we introduce the idea of saving R scripts.